Frustrated students, who have grown tired of poor levels of accommodation and rising rents, are joining forces to create a National Body of Student Housing...
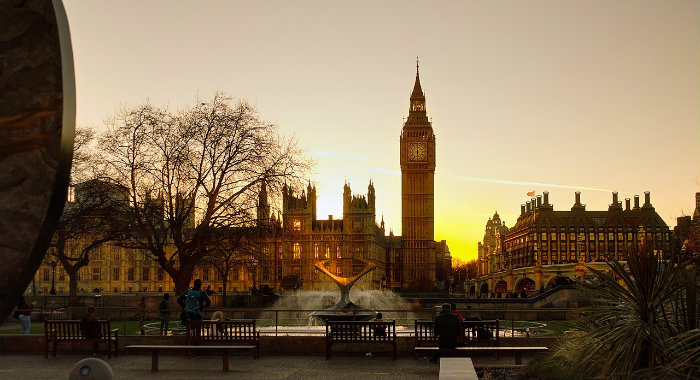
In an attempt to make property more affordable for British residents, the Government plans to increase the stamp duty surcharge for foreign buyers. Theresa May...
Social media giant Facebook has joined forces with online property portals Zoopla & OnTheMarket. The deal means that hundreds of thousands of properties will now...
Lenders have punished desperate homeowners who took loan repayment holidays from their bank at the peak of the pandemic with higher mortgage rates and rejections...
The Government has announced new proposals designed to help rebalance the relationship between social housing tenants and landlords. The social housing green paper asked residents...
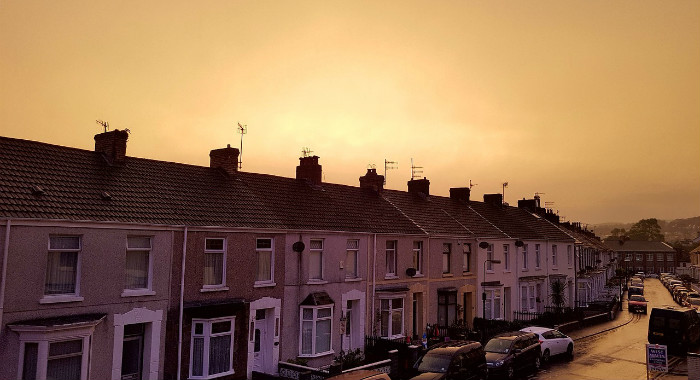
While London’s property market is suffering a period of stagnation, some regions in the UK are enjoying a remarkable and unexpected bonus. As London’s property...
According to analysis by property agency Hamptons, a record-breaking 73% of property buyers in 2022 so far have been chain-free. The research conducted by the...
12 December 2023 – Rightmove’s latest House Price Index suggests that property asking prices fell by 1.9% this month compared to last month, contradicting figures...
While the temperatures are rising in the UK, and potentially reaching record heights, there are signs that the property market is cooling down, giving many...
Experts have warned that an imminent crackdown on energy upgrades will trigger an exodus of landlords from the private rented sector. The Government intends to...